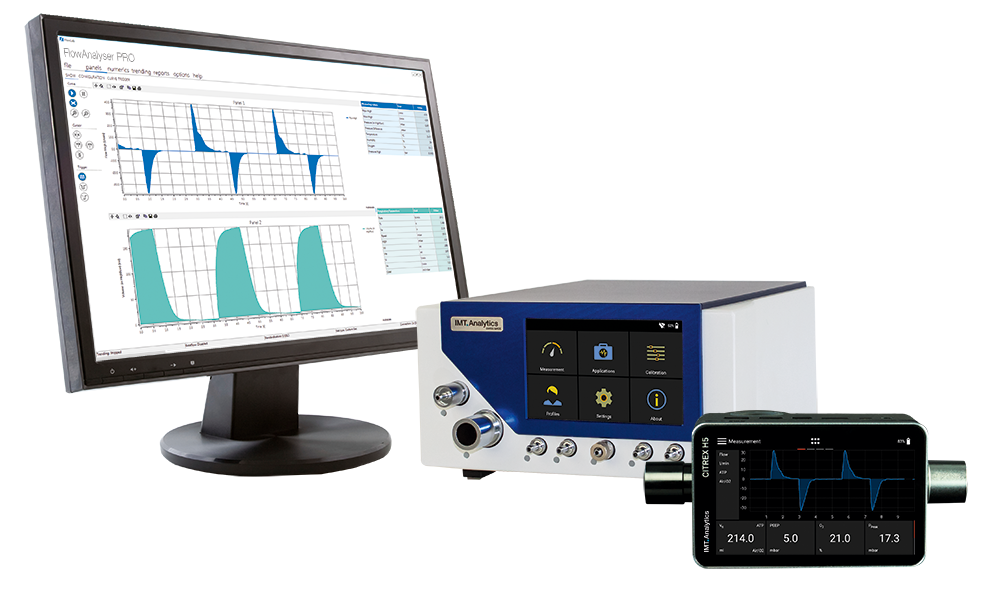
FlowLab
Software for FlowAnalyser and CITREX.
Monitor and save your ventilation parameters of flow, pressure, and volume measurements comfortably on your PC. FlowLab graphically displays your measured values numerically or as real-time curves. Trending reports are generated with up to 100 hours of data to check the long-term functionality of your device. Simplify the verification process of your ventilation equipment by creating your own individual test reports that can be stored electronically or printed.
The FlowLab software is available in 15 languages.
Watch the film
Download FlowLab
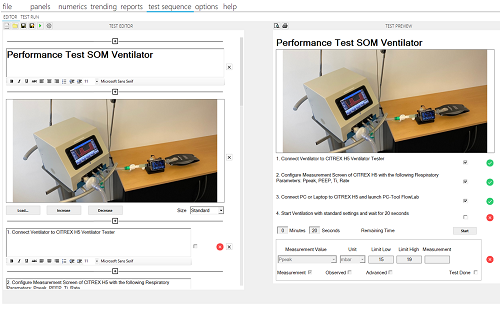
Test Sequence – efficiently define custom test reports.
Create test sequences for any medical device that produces pressure or flow such as a ventilator or anesthesia machine. A powerful editor allows you to design your test sequence by inserting components such as text, graphics, images, measured values and more. Very efficiently reproduce a test sequence specified by the medical device manufacturer. Run tests and generate PDF test reports with an electronic signature and your company’s logo. Test sequences can be saved for reuse, sharing, and standardization across your organization.
Watch the film
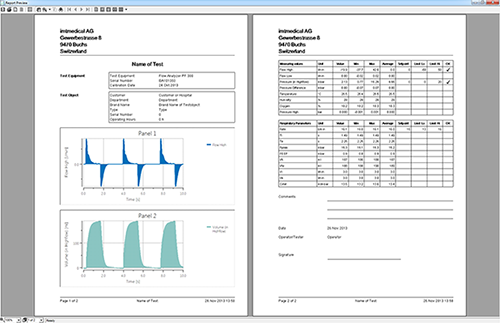
Test Report – Important tests should be clearly documented.
With a few clicks, measurement values can be saved directly from FlowLab into a report and printed out. Freely definable content allows you to design test reports according to your needs. Thus, in addition to the measured values, all the data of the test object is documented for a clear overview.
The generated control numbers help you keep an overview of your test reports and assign the correct document to the corresponding test object, even after a long time. You can also easily insert your company logo, so that each report can be visually recognized as a company document.
FlowLab helps you automatically create clear documents and saves you the trouble of creating test reports in word processing programs.
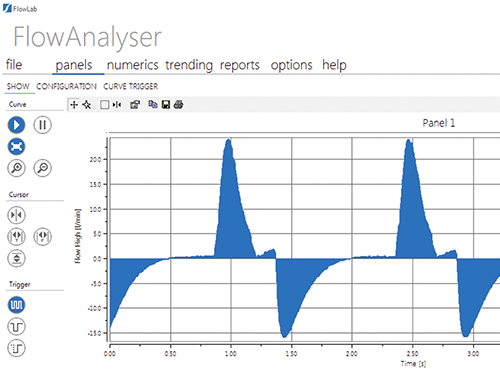
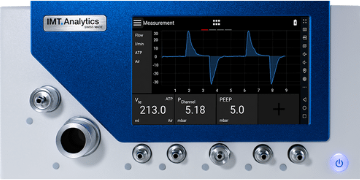
Real-time curves – Detailed display options at a glance.
For precise analysis of measured values, up to six time-dependent curves can be displayed in FlowLab. The adjustable cursors allow measurement curves of all ventilation parameters to be measured. In the curve trigger settings, you can, among other things, set trigger types or triggering thresholds so that only the desired measuring ranges of the curves are displayed.
To obtain an overview, all curve fields can be color-matched or labeled individually.
With just one click, all curve fields can be saved as an image or printed out.
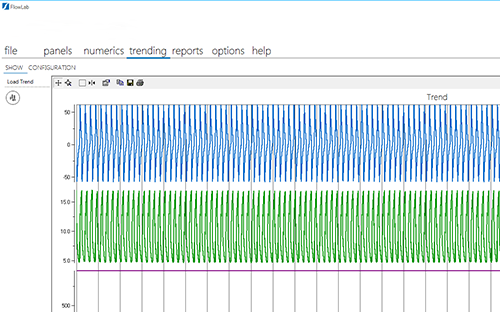
Trending – Record, export and analyze.
The trending function of FlowLab allows you to trend measurements for up to 100 hours. It is very easy to select up to 10 measured values and define settings such as recording time, recording rate and time axis. The recorded values can then be exported to an Excel spreadsheet, giving you the possibility to carry out individual evaluations in a calculation program outside of FlowLab.
FlowLab’ s trending capability is the right function when it comes to performing troubleshooting.
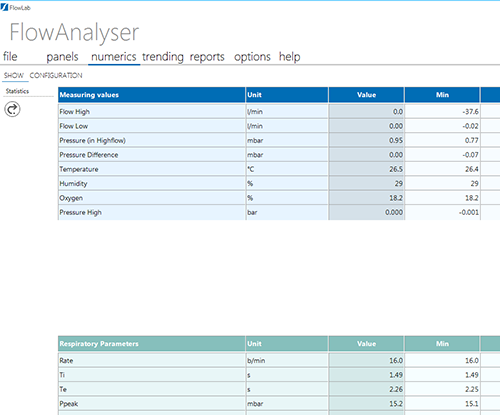
Numerical display – Clear presentation of desired values.
In the numeric display in FlowLab, up to 20 measured values can be displayed and sorted simultaneously. In addition, statistical variables such as mean, minimum and maximum values are displayed in real time and can be compared with predetermined set points and tolerances if desired. This makes it easy to see if a certain measured value is within the specified tolerances of the measurement object. Everything at a glance, freely configurable and clearly presented. The optimal display to compare measured values and carry out tests quickly.