FlowLab
Software für FlowAnalyser und CITREX.
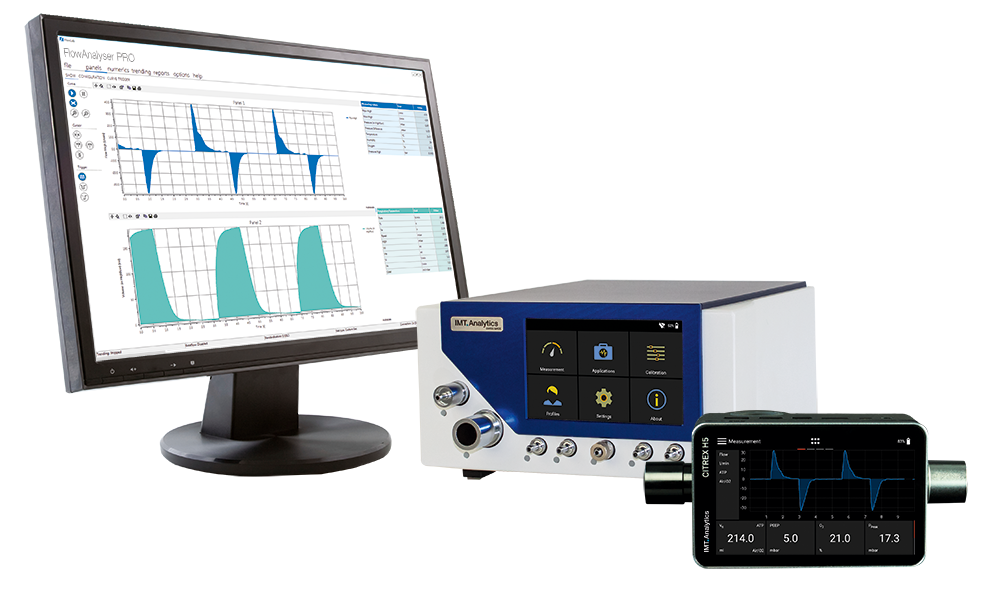
Überprüfen Sie Fluss-, Druck- und Volumen-Messungen bequem auf Ihren PC-Monitor, während Sie gleichzeitig Ihre Beatmungs-Parameter speichern. FlowLab stellt Ihre Messwerte grafisch als Echtzeit-Kurven oder numerisch auf Ihrem PC dar. Um die langfristige Funktionalität Ihres Gerätes zu überprüfen, können Trending-Berichte bis zu 100 Stunden generiert werden. Vereinfachen Sie den Überprüfungsprozess Ihrer Beatmungsgeräte, indem Sie Ihren eigenen, individuellen Prüfbericht erstellen, der sich elektronisch speichern und ausdrucken lässt.
Die FlowLab-Software ist in 15 Sprachen erhältlich – mehr, als jede andere Messgeräte-Software bietet.
Film ansehen
Download FlowLab
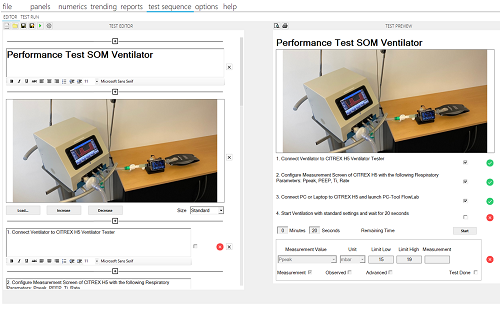
Testsequenz - Definieren Sie effizient benutzerdefinierte Testabläufe.
Erstellen Sie Testsequenzen für jedes medizinische Gerät, das Druck oder Durchfluss erzeugt, z. B. ein Beatmungsgerät oder ein Anästhesiegerät. Mit einem leistungsstarken Editor können Sie Ihre Testsequenz entwerfen, indem Sie Komponenten wie Text, Grafiken, Bilder, Messwerte und mehr einfügen. Reproduzieren Sie eine vom Hersteller medizinischer Geräte angegebene Testsequenz sehr effizient. Führen Sie Tests durch und erstellen Sie PDF-Testberichte mit einer elektronischen Signatur und dem Logo Ihres Unternehmens. Testsequenzen können für die Wiederverwendung, Freigabe und Standardisierung in Ihrem Unternehmen gespeichert werden.
Film ansehen
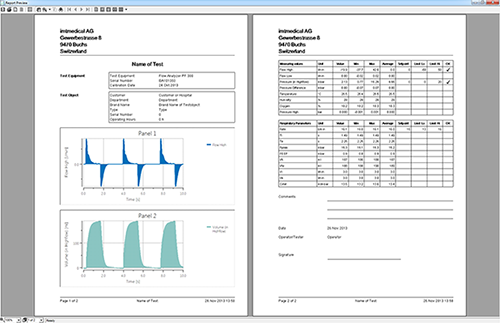
Prüfberichte – Wichtige Tests übersichtlich dokumentieren.
Mit wenigen Klicks speichern Sie Messwerte direkt aus der FlowLab-Software in einen Bericht oder drucken sie aus. Frei definierbare Inhalte erlauben Ihnen die Gestaltung des Prüfberichts nach Ihren Wünschen. So können Sie neben den Messwerten auch alle Angaben des Prüfobjekts erfassen und übersichtlich darstellen.
Die erzeugten Kontrollnummern helfen Ihnen, die Übersicht über Ihre Prüfberichte zu behalten und dem richtigen Prüfobjekt auch später noch das richtige Dokument zuzuordnen. Ihr Firmen-Logo können Sie einfach einfügen, damit jeder Bericht als Firmen-Dokument dargestellt wird.
Die FlowLab-Software hilft Ihnen, automatisch übersichtliche Dokumente zu erstellen und erspart Ihnen das Erstellen von Prüfberichten in Textverarbeitungs-Programmen.
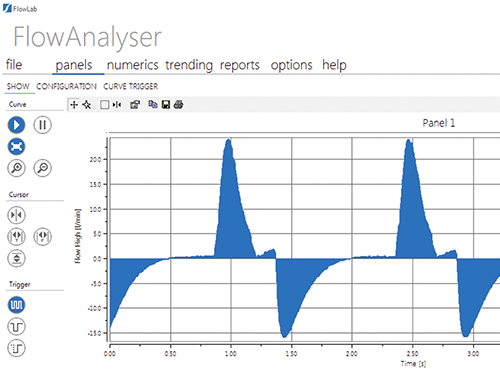
Echtzeit-Kurven – Ausführliche Darstellungen auf einen Blick.
Zur genauen Analyse von Messwerten können Sie in der FlowLab-Software bis zu sechs zeitabhängige Kurven darstellen. Mit dem einstellbaren Cursor können Messkurven aller Beatmungs-Parameter vermessen werden. In den Einstellungen der Kurven-Trigger lassen sich unter anderem Trigger-Typen oder Trigger-Schwellen einstellen, um Ihnen ausschliesslich die gewünschten Messbereiche der Kurven anzuzeigen.
Für eine übersichtliche Darstellung können Sie alle Kurven-Felder individuell beschriften oder farblich anpassen.
Mit einem einzigen Klick können Sie ausserdem alle Kurven-Felder als Bild speichern oder ausdrucken
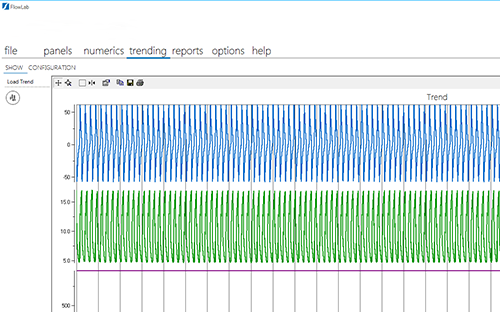
Trending – Aufzeichnen, exportieren und analysieren.
Mit der Trending-Funktion der FlowLab-Software erfassen Sie Messwerte bis zu 100 Stunden. Wählen Sie einfach bis zu zehn Messwerte und definieren Sie Einstellungen wie Aufzeichnungsdauer, Aufzeichnungsrate und Zeitachse. Ihre aufgezeichneten Werte exportieren Sie anschliessend in ein Excel-Dokument und nutzen alle Möglichkeiten einer individuellen Auswertung, die ein komfortables Tabellen-Kalkulations-Programm bietet.
FlowLab-Trending ist die richtige Funktion, wenn Sie effizient Troubleshootings durchführen wollen.
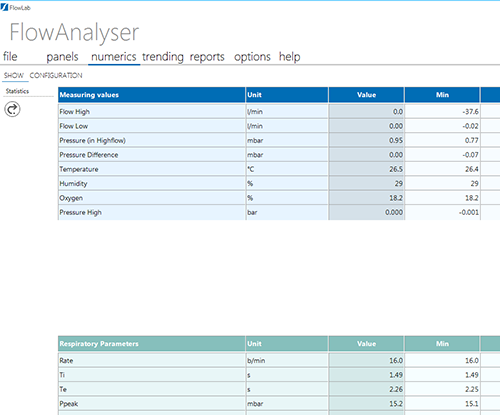
Numerische Anzeige – Gewünschte Werte übersichtlich darstellen.
In der numerischen Anzeige stellen Sie in der FlowLab-Software bis zu 20 Messwerte gleichzeitig und geordnet dar. Statistische Grössen wie Mittel-, Minimal- und Maximalwerte werden Ihnen zudem in Echtzeit angezeigt und können auf Wunsch mit voreingestellten Sollwerten und Toleranzen verglichen werden. So sehen Sie auf einen Blick, ob ein bestimmter Messwert innerhalb der vorgegebenen Toleranzen des Messobjektes liegt. Die FlowLab-Software stellt alles frei konfigurierbar und übersichtlich dar, mit der optimalen Anzeige, um Messwerte zu vergleichen und Tests schnell durchzuführen.